Implementation
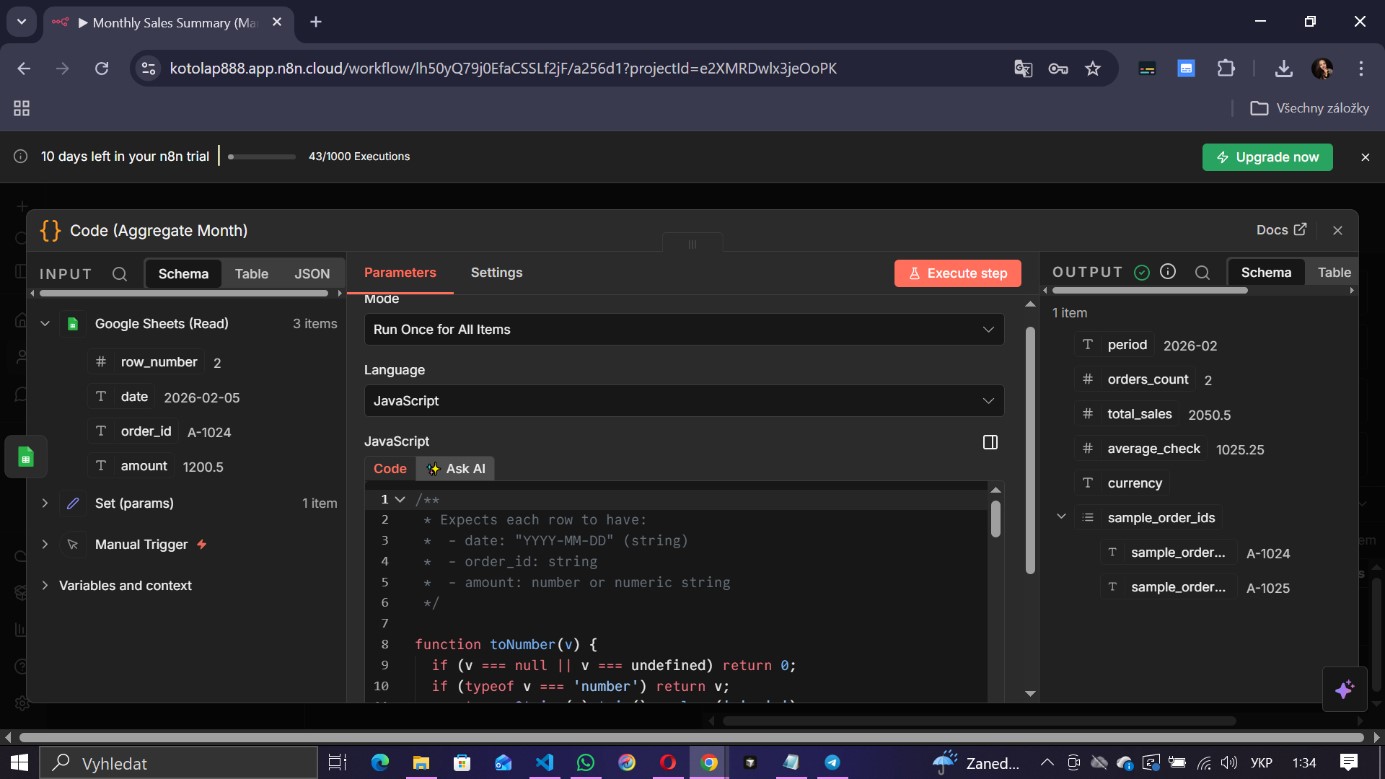
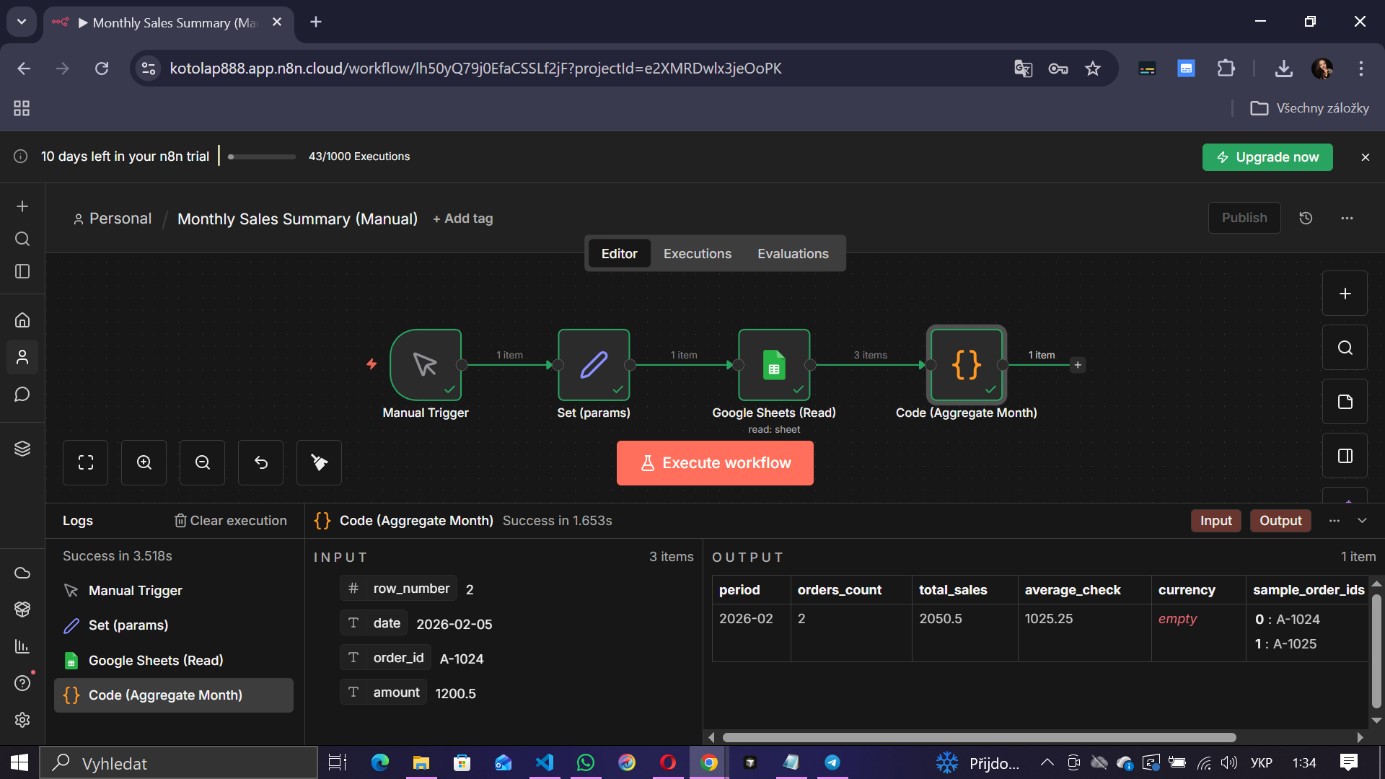
High-level flowBuilt a structured automation pipeline in n8n with a deterministic JavaScript aggregation layer (no LLM randomness). Dynamic parameters (spreadsheet_id, sheet_name) are injected via Set node.
- Manual Trigger → runs on demand (easy to schedule later)
- Set (params) → spreadsheet_id + sheet_name=Sales
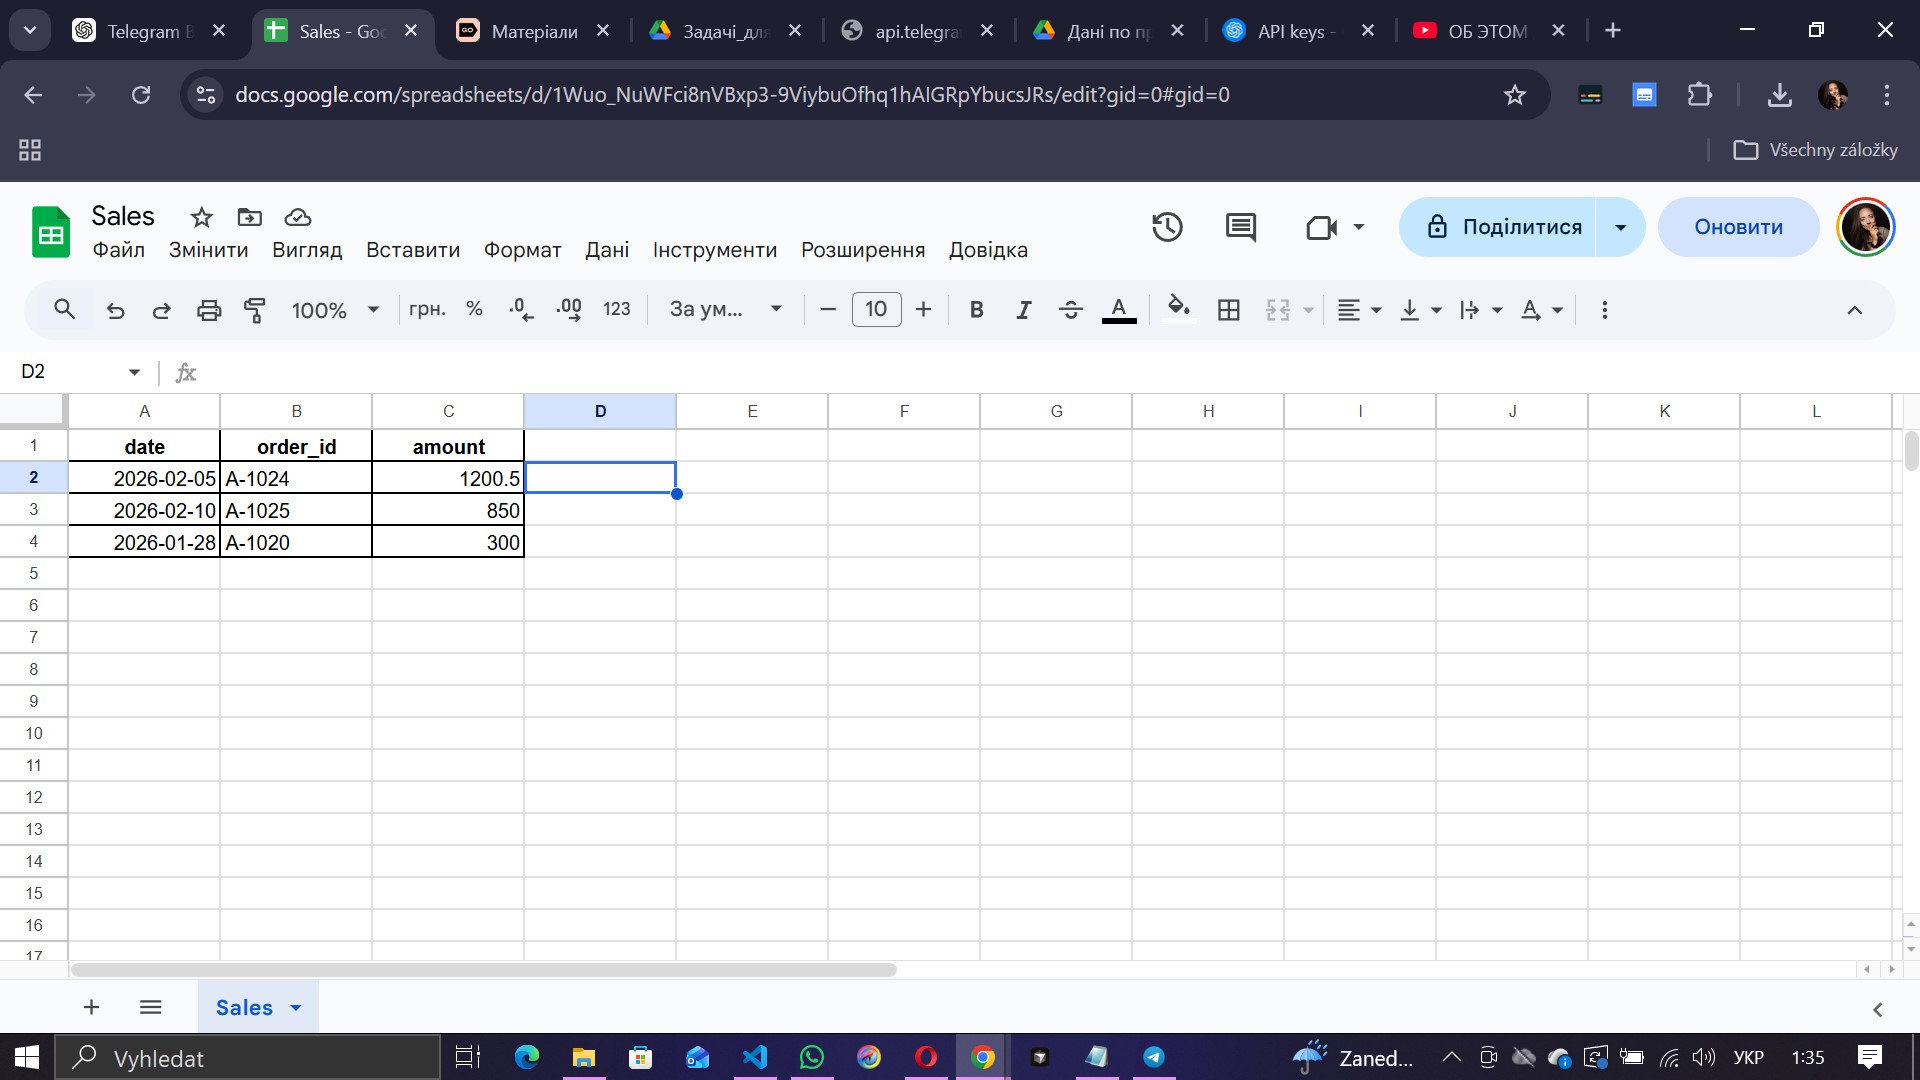
- Google Sheets (Read) → fetch raw orders rows
- Code (Aggregate Month) → metrics: orders, revenue, avg чек, sample IDs
Example Output (JSON)
{
  "period": "2026-02",
  "orders_count": 2,
  "total_sales": 2050.5,
  "average_check": 1025.25,
  "currency": "",
  "sample_order_ids": ["A-1024", "A-1025"]
}
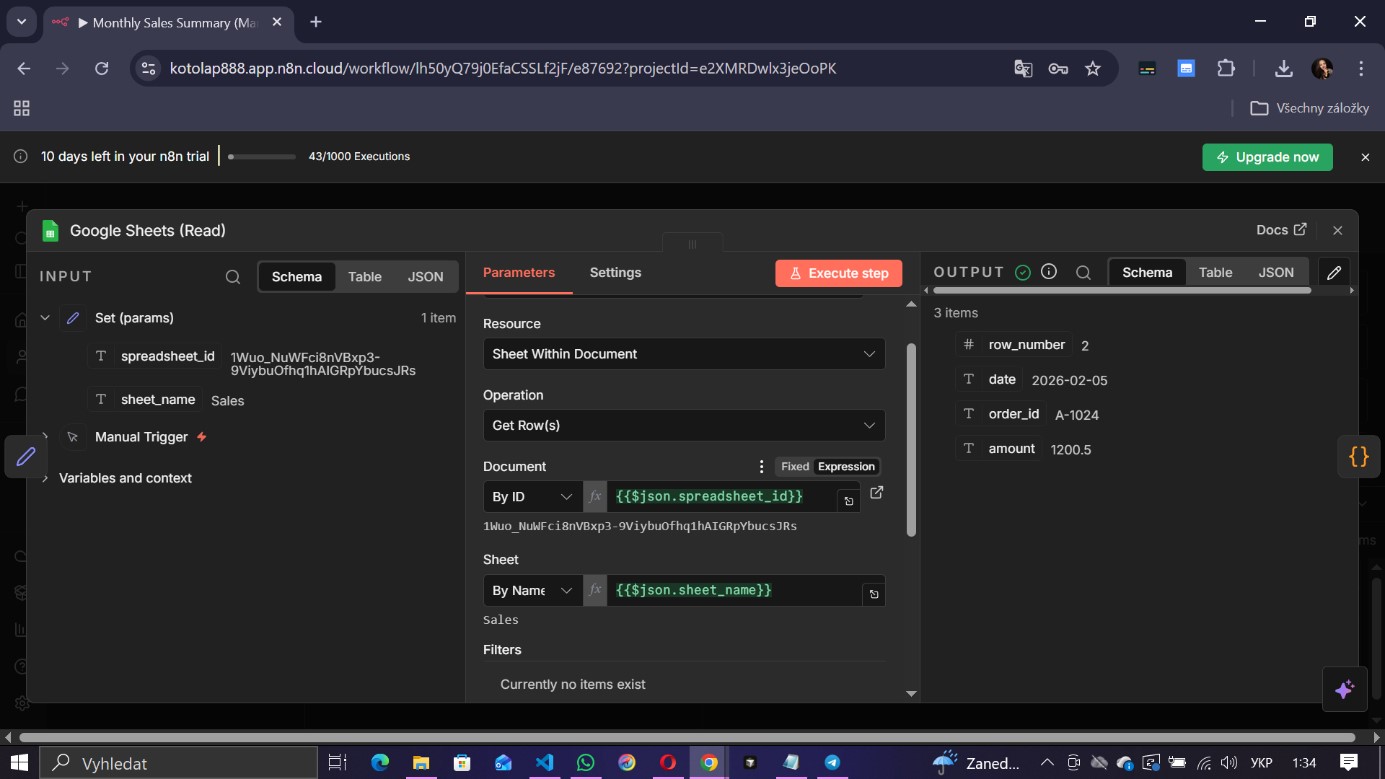
JavaScript / Code Node (example)
// Example deterministic monthly aggregation (conceptual)
function safeNum(v){ const n = Number(String(v).replace(',','.')); return Number.isFinite(n) ? n : 0; }

const rows = $json.rows || $json; // depends on your Sheets node output
const now = new Date();
const month = String(now.getMonth()+1).padStart(2,'0');
const year  = String(now.getFullYear());
const period = `${year}-${month}`;

const inMonth = (d) => {
  const dt = new Date(d);
  if (isNaN(dt)) return false;
  return dt.getFullYear() === Number(year) && (dt.getMonth()+1) === Number(month);
};

let orders = 0;
let total = 0;
const sampleIds = [];

for (const r of rows){
  const date = r.date || r.Date || r[0];
  const orderId = r.order_id || r.orderId || r[1];
  const amount = safeNum(r.amount ?? r.Amount ?? r[2]);

  if(!date || !orderId) continue;
  if(!inMonth(date)) continue;

  orders++;
  total += amount;

  if(sampleIds.length < 20) sampleIds.push(String(orderId));
}

const avg = orders ? total / orders : 0;

return {
  json: {
    period,
    orders_count: orders,
    total_sales: Number(total.toFixed(2)),
    average_check: Number(avg.toFixed(2)),
    currency: "",
    sample_order_ids: sampleIds
  }
};